Analysis
Pet Economy in the Indian Household
India’s relationship with pets is changing as animals become increasingly central to household life and spending grows into a significant consumer category. The article examines forces shaping India’s emerging pet economy.

India’s pet care industry has entered a phase of disciplined expansion. Over the past five years, growth has held steady at an estimated 18 to 20 per cent annually, with market size projections crossing USD 7 to 8 billion by the end of the decade. What distinguishes this cycle from earlier periods of growth is the composition of demand.
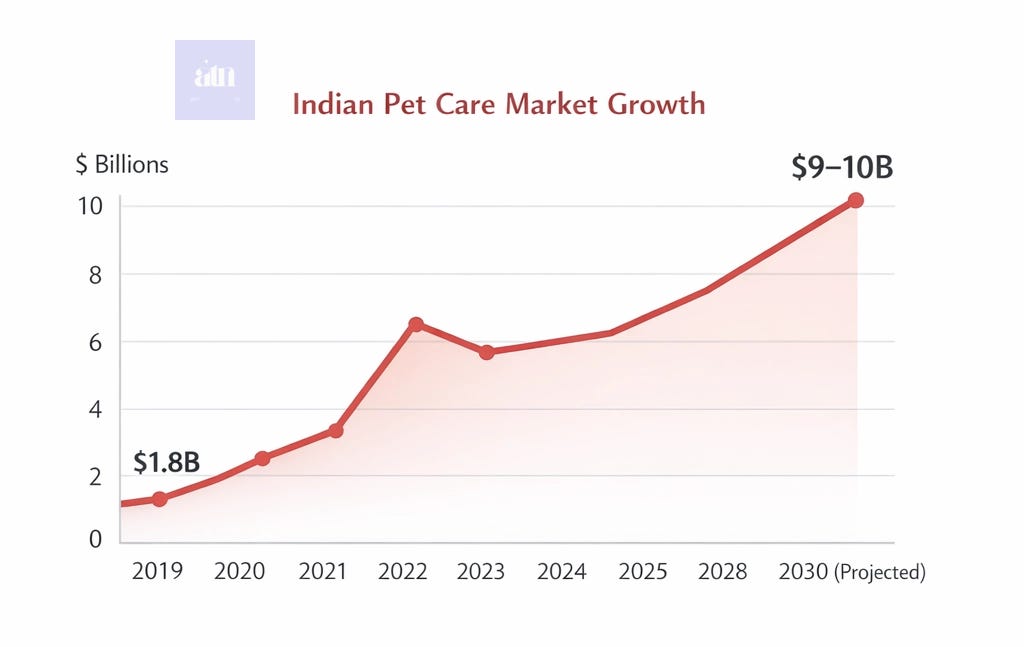
India pet care market size (USD billion), 2019–2030 projected.
Urban households have begun to reorganise spending in ways that place their pets at the centre of discretionary consumption. This shift is most visible among double-income households without children, often described as DINK. In homes with pets, the term extends informally to DINKWAD or DINKWAC, reflecting the presence of a dog or a cat within the household.
Industry surveys across 2024 and 2025 show that pet ownership in India has crossed 30 million households, with dogs accounting for the majority. Adoption rates in metropolitan regions such as Mumbai, Bengaluru, and Delhi NCR continue to outpace the national average. What stands out is the intensity of engagement. Households are spending more frequently, across more categories, and with greater willingness to move up the price ladder.
Annual Spend Snapshot (Urban India)
₹25,000 to ₹70,000 per pet per year
Upper-income households exceed ₹1 lakh annually
Multi-pet households show higher cumulative spend with category diversification
Annual expenditure per pet in urban India now ranges between ₹25,000 and ₹70,000, with upper-income households exceeding this significantly. The distribution of this spend reveals a clear hierarchy.
Spend Distribution by Category
Food and nutrition: 40 to 50 per cent
Healthcare and veterinary services: 15 to 25 per cent
Grooming and hygiene: 10 to 15 per cent
Accessories, toys, and enrichment: 10 to 20 per cent
Services such as boarding, training, and daycare: growing share
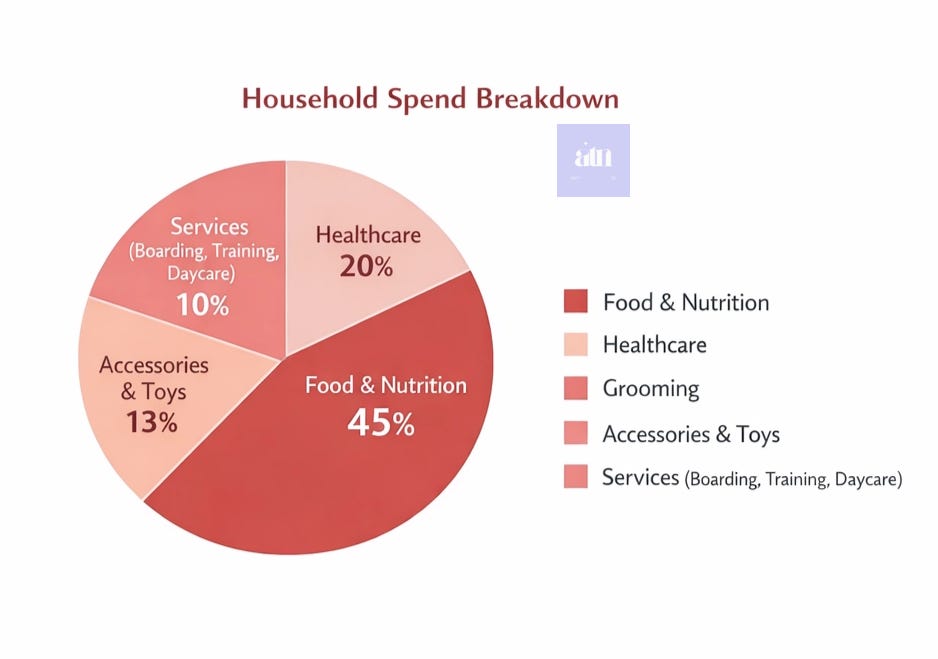
Share of annual pet care spend in urban India by category.
Nutrition remains the largest category. Within this, there is a visible preference for premium and specialised diets. Grain-free formulations, breed-specific nutrition, and functional foods that address digestion, skin health, and ageing continue to gain adoption.
Healthcare is the second major pillar. Preventive care has gained traction, with routine vet visits, vaccinations, and diagnostics becoming standard practice among urban pet owners. The early growth of pet insurance indicates a gradual shift toward long-term health planning. Veterinary networks report increased uptake of advanced treatments and diagnostic procedures.
Grooming and hygiene have evolved into a recurring expense. Professional grooming now appears at predictable intervals in urban consumption patterns. Subscription-led services and at-home care models have expanded access while reinforcing regularity.
The most significant change lies in the expansion of services. Boarding, training, daycare, and pet-friendly travel now operate as organised, revenue-generating segments. Pet cafés, community events, and owner networks continue to grow across cities. These spaces create shared environments where pets shape social interaction and influence how people spend time outside the home.
E-commerce has also accelerated this transition. Online platforms account for a substantial share of pet product sales, driven by assortment, pricing, and delivery convenience. Premium offline retail has gained traction through curated environments and advisory-led selling. Brands such as Heads Up For Tails have scaled by combining product depth with service integration, creating retail formats aligned with lifestyle consumption.
The DINK household sits at the centre of this transformation. With higher disposable income and fewer financial commitments tied to childcare, these households allocate a significant share of discretionary spending toward their pets. Spending patterns show consistency and intent, guided by quality, safety, and long-term value.
Consumer research indicates that over 60 per cent of urban pet owners consider their pets as family members. This perception informs purchasing behaviour across categories. Owners invest in preventive healthcare, premium nutrition, and enrichment activities. Ingredient transparency, sourcing standards, and sustainability considerations are gaining relevance.
From a market perspective, this creates a category with strong demand stability. Core segments such as food and healthcare continue to see steady consumption even during periods of economic pressure.
India’s pet care industry now sits within a larger reordering of the urban household. Care, responsibility, and daily life are being redefined in ways that place the pet at the centre of decision-making. Spending patterns reflect this change. As incomes rise and urban living becomes more fluid, the pet shapes how households organise their own time, space, and routine.
Data Sources & Reports
RedSeer Consulting (2024–2025) — India Pet Care Market Landscape
IMARC Group (2025) — India Pet Food Market Report
Mordor Intelligence (2024–2025) — India Pet Care Industry Analysis
Euromonitor International (2024) — Pet Care in India
Mars Petcare India — Industry insights and trend reports
Heads Up For Tails — Consumer insights (2024–2025)
NielsenIQ — Urban consumption and premiumisation trends
Statista — India pet ownership and spending data
India International Pet Trade Fair (IIPTF), FICCI / EY — industry summaries and retail reports
Kornica Dhar